Startup Financial Modeling, Part 2: Start with Your Assumptions

In the previous post of this series we described what financial modeling is and why it is important for startup founders to build their own models from scratch. Today, we’ll begin by diving into how to practically start building a financial model.
Good financial models are built from the bottom up. They have assumptions that flow into backup sheets that flow into monthly statements that flow into annual summaries. You literally start with the smallest component and start building up.
WHAT IS AN ASSUMPTIONS TAB?
The assumptions tab should be the first tab within your spreadsheet and contain variables that will be referenced from other tabs. Rather than manually enter data into your income statement, you’ll roll up variables across your assumption and detail tabs. The ONLY place you should ever type a number is into an assumption cell. Every other cell is a calculation based on the assumptions!
The types of assumptions you’ll want to define are unique for your business type. Most commonly they are related to expected revenue from each product/service you sell, expected costs, initial investment dollars in the bank, etc…
WHERE TO GET YOUR DATA
Don’t just randomly guess your expected revenue and costs. Do your homework. Often industry averages will be published online for you to look up, or you can ask people in your network who are familiar with your business and market.
In addition, study your competition carefully. The obvious low-hanging-fruit research is if they have publicly available annual reports where you can glean specific information about cost of goods, productivity of sales reps, salary info, etc… But even if the data isn’t directly public, very often helpful numbers are posted in blogs or articles online. But be careful - just because you find out that a large public company spends 12% of its annual revenue in marketing, does not mean that is the right ratio for you. Most startups spend money in marketing long before they have ANY revenue, it is how they intend to get revenue - very different!
WORKING WITH AN EXAMPLE COMPANY
We’ll use an example company called Dollar Cave Club:
Dollar Cave Club is the latest in a series of companies that make recurring purchases easy and painless. Sign up for our $29.99 monthly subscription and we will send you a box each month with essentials for your Man Cave. One month it is a classic poker set, the next an amazing set of beer steins. If you cannot wait to get your favorite dart board, you can come to the site directly and buy anything we sell.
We get most of our new customers from SEO, advertising on Google and Facebook. We have such a highly desirable audience that many people want to advertise to our visitors on our site as well.
Subscribers can “add-on” to their monthly subscription by selecting any items in our catalogue and shipping is free! Our churn has been around 4% per month and as our traffic to the site is growing as well as our sales.
Here are things we know about the company:
- Subscription Price $29.99
- Churn = 4% Monthly
- Something about SEO, SEM and Facebook
- Add-ons to subscriptions
- Some advertising revenue
Here are things we don’t know about the company:
- What impact does selling ads on our site have?
- What impact will increasing Ad spend have?
- Can we make Ad spend more realistic? How?
- What if we raise more money?
- What impact does conversion rate have on the business?
START BY FILLING IN YOUR REVENUE-RELATED ASSUMPTIONS
We’ll start the assumptions tab by filling in our best guess of every aspect of our company related to revenue(obviously you’ll add/remove things as you go, but this is a good place to start):
- Subscription Price:
- $29.99
- Churn on subscriptions per month:
- 4%
- Page views per visit:
- 3.5
- CPM growth per month on ads sold
- 10%
- Max CPM on ads sold
- $1.50
- Steady State Monthly SEM Spend
- $10,000
- Steady State Monthly Facebook spend
- $10,000
- SEM -> Subscription Conversion
- 2.00%
- Facebook -> Subscriber Conversion
- 1.00%
- SEM -> eCommerce Conversion
- 4.50%
- Facebook -> eCommerce Conversion
- 2.50%
- Organic Traffic -> Subscriber Conversion
- 0.20%
- Organic Traffic -> eCommerce Conversion
- 0.50%
- Organic SEO Traffic monthly growth rate
- 10%
- Direct Traffic Multiplier
- 33%
- Average CPC on SEM (Google)
- $2.25
- Average CPC on Facebook
- $1.85
- Visits per FB Post with Picture
- 5
- Visits per FB Post with Video
- 25
- Subscription Margin
- 25.00%
- eCommerce Margin
- 30.00%
NEXT, FILL IN YOUR COST ASSUMPTIONS
Similar to revenue assumptions above, now you should list out common monthly costs like IT infrastructure, rent, legal, taxes, travel, etc…
- Internet Infrastructure base cost / mo
- $500
- Incremental for each 1 million visits
- $250
- Orders / warehouse help person
- 5000
- Taxes and benefits load
- 25%
- Rent per employee per month
- $500
- Tech Cost per employee per month
- $100
- Legal and Accounting Cost per month
- $500
- Travel cost per employee per month
- $250
- Training Budget per employee per month
- $100
- Recruiting per added employee
- $5,000
- FINALLY, LIST OUT CASH AND OPERATIONS ASSUMPTIONS
For example:
- Opening Cash Balance
- $1,000,000
- Raise at Month 13
- $2,500,000
- Average Accounts Receivable Days
- 30
- Average Accounts Payable Days
- 60
- Inventory Days On Hand
- 30
ASSIGN DESCRIPTIVE LABELS FOR YOUR ASSUMPTIONS BEFORE YOU USE THEM
For each of your assumptions, use the feature your spreadsheet software has to label your variables. Just like in programming, make your variable names as descriptive as possible so your model can be more easily read.
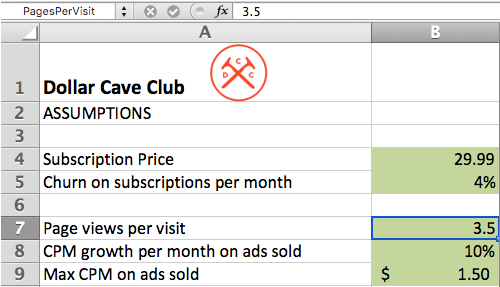
For example, here’s where we defined “Page views per visit” (PagesPerVisit):
Now whenever we refer to page views per visit in the rest of our spreadsheet, we can use the label PagesPerVisit rather than the ambiguous ‘Assumptions’!B18.
CONTROLLING THE SIZE OF YOUR ASSUMPTIONS LIST
As you build out the assumptions tab for your business, it will be tempting to create tons of variables that you may or may not need as your build out the rest of your financial model. Therefore, it is best to stick with a core set of revenue and cost assumptions, and add in more when you realize you need them. Just remember, again, to assign your label names before you include the variable in an equation anywhere in your spreadsheet (a common Excel gotcha).
In the next post in this series, we’ll continue building our example financial model by diving into the income statement and custom detail tabs. Subscribe to Will’s newsletter to get notified when the next articles are up. Feel free to ping us on Twitter (@wclittle, @troyhenikoff) with any questions.